Did you know that there are more than 2.5 billion connected phones and digital communication devices and computers on the planet. There are over 1 billion Internet subscribers!( Wagner pg 1)*. With so many people being connected, you have a whole new set of learners that view and interact with the world differently. Due to this fact, we as teachers, therefore have to change the way that we and our students present content and material.
For today’s tech snack, I want to talk to you about two online tools that allow for this presentation change. These tools can be found at the following urls:
http://www.easel.ly/
https://infogr.am/
Using either one of these tools, one can create dynamic and powerful infographics. What are infographics, you ask? Infographics are visual presentations of information that use the elements of design to display content. Infographics express complex messages to viewers in a way that enhances their comprehension. Images are often an extension of the content of a written article, but infographics convey a self-contained message or principle.
Nancy Margulies of the John Hopkins University refers to the use of infographics as a "mindscaping" activity in which students participate in note-taking that "...engages the learner in recording ideas and grouping them instead of hastily writing sentences or letting their attention wander. As a result students are able to focus on learning in an active, rather than passive manner.” In other words, infographics are a creative way to allow for a personalized learning approach that enables students to voice understanding of content rather than focusing on memorization of facts.
So let’s get to the nitty gritty about these tools. Both sites allow the user to create infographics using premade templates that can be changed and modified to meet the needs of the user. They are very similar in what they offer, so I created a Venn Diagram to highlight their differences:
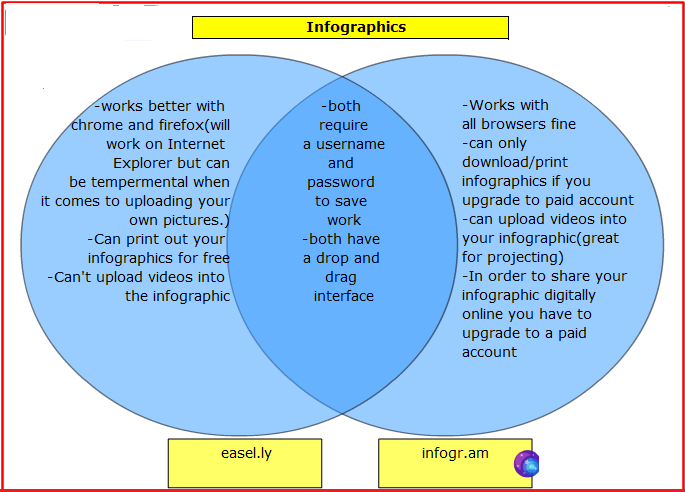
Personally, I prefer using easel.ly because I like the selection of templates and like being able to add and move content as needed. Infogr.am’s interface is a little simpler, but I felt a little limited by the choices I was given. It is a matter of preference really, as both sites are wonderful for creating infographics.
If you want to see examples of infographics I have created using easel.ly, click on the link below:
infographic.pdf
Ah, now that's what a call a refreshing snack! Yummy!
*Wagner, Ellen Delivering on the promise of eLearning. Adobe Systems, 1-8.
If you want to see examples of infographics I have created using easel.ly, click on the link below:
infographic.pdf
Ah, now that's what a call a refreshing snack! Yummy!
*Wagner, Ellen Delivering on the promise of eLearning. Adobe Systems, 1-8.

 RSS Feed